
In Context: Half Life
Can you do more than just calculate a half life from a graph in an exam question? See the concept of half - lives applied in context, determining the radioactive impact that isotopic decay will have over time after nuclear fission has occurred. Read on to gain an understanding of the importance of half life graphs, and have a go at plotting some yourself!
As an isotope decays, the number of nuclei that remain will decreases, as will the activity (decays per second) caused by the decay of the isotope. The half-life is the time taken for the activity (or number of original nuclei) of an isotope to drop to half of its initial value. Every time a half-life passes, the activity (and number of nuclei) will halve.
At A-Level and GCSE you will be asked to calculate the half-life, given either a graph or some data on decays over time. Half-lives can also be used (rather than calculated) to map out the expected decay and relative abundances of a series of isotopes.
Using data on half-lives the relative abundances of each isotope can be determined after fission, and therefore the type and amount of radiation being emitted, the amount of activity. The shielding and length of time required to store substances until they are passively safe can then be determined.
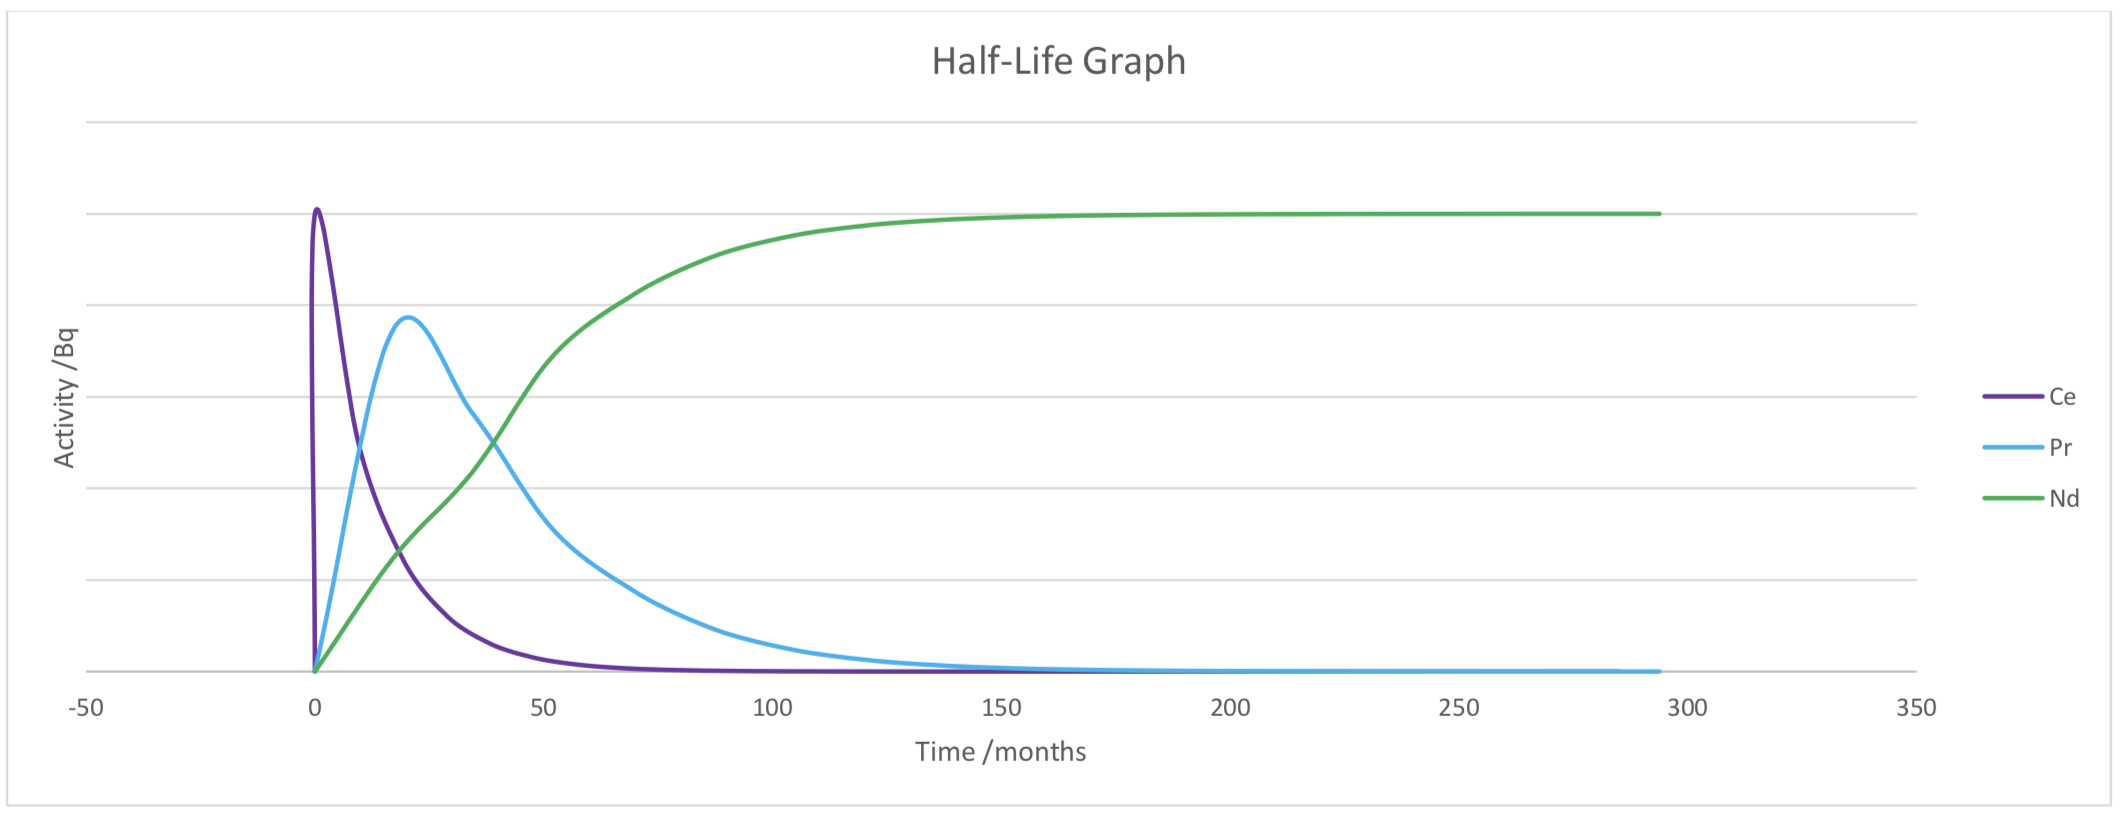
Here is an example of the decay of Xenon – 144. The relative decay and the relative proportions of the different isotopes are shown on the graphs below.


Each subsequent isotope decay from Xenon experiences a peak activity, when the decay of the previous isotope is decreasing (usually close to zero) and before a significant decay of the isotope itself. The greater the difference in half-life, the greater the peak.
The decay of Xenon and Caesium is rapid. Within the first 10 seconds they have both significantly decayed. Due to the similar half-life the peak activity of Caesium is lower than that of Xenon. The half-life of barium is much longer that of Xenon and Caesium, meaning that nearly all of the Xenon and Caesium has decayed to Barium. The same can be seen for the decay of Barium and Lanthanum.
The activity will continue to be high for many years, the latter three radioactive isotopes in the decay chain each take an increasing amount of time to decay, meaning storage will be required for a very long period of time. Most of the beta decay will have occurred after 15 years, with alpha decay (decay of Nd- 144) continuing for an infinite amount of time.
The graph below represents the first two decays of one of the decay chains below. Which decay chain is it? Can you plot the final few decays for the decay chain?

